Global procurement now shapes more than price, quality, and delivery schedules. It also influences c02 emissions across factories, warehouses, transport routes, offices, and product lifecycles. A supplier’s steel mill may burn coal, while a simple delivery can involve ships, trucks, and refrigeration. These hidden layers matter.
Climate economist Gernot Wagner describes climate change as “a problem from hell.” His warning fits procurement decisions, where incomplete data can make responsible companies appear cleaner than they are. This guide examines the top 10 types of c02 emissions relevant to global procurement. It covers direct fuel use, purchased electricity, supplier manufacturing, raw materials, freight, business travel, packaging, waste, product use, and end-of-life treatment. Each category reveals a different measurement challenge.
The practical evidence is often messy. Supplier records may use different reporting years, conversion factors, or boundaries. That weakness deserves attention, not concealment. Procurement teams can begin with invoices, shipment weights, energy records, and supplier questionnaires. They can then compare emission intensity, verification quality, and reduction plans. Not every low-cost supplier is low-carbon. Not every sustainability claim is reliable.
This overview connects procurement activity with recognized greenhouse-gas accounting principles and real operational choices. It explains where emissions usually occur, what evidence supports a credible estimate, and which questions buyers should ask before signing contracts. The goal is not perfect data overnight. It is better visibility, stronger decisions, and measurable progress.
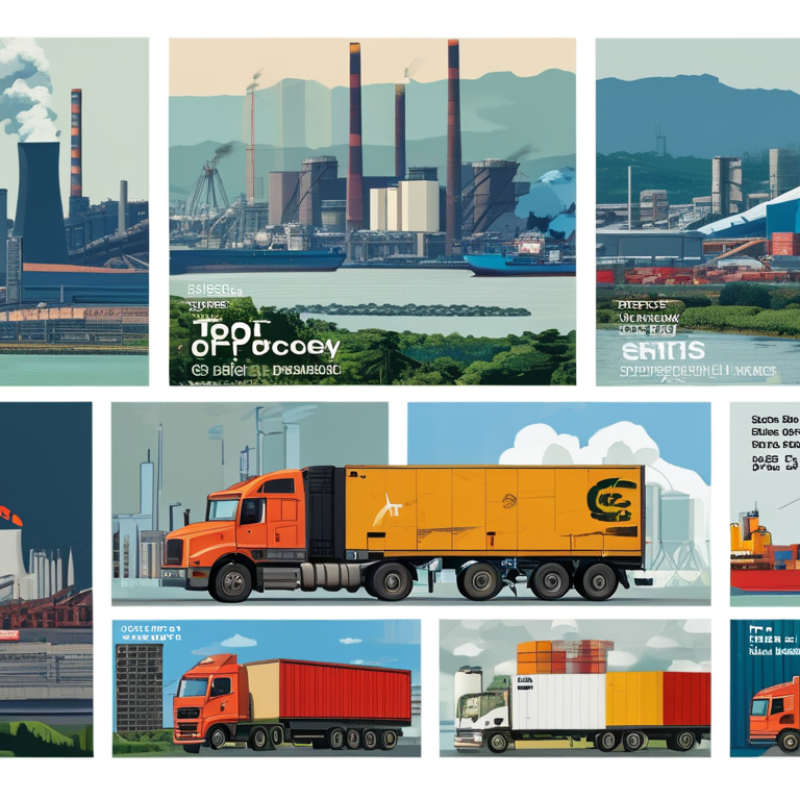
Defining CO2 emissions in global procurement starts with the purchasing decision, not the invoice. Procurement-related emissions include carbon dioxide and other greenhouse gases, usually reported as carbon dioxide equivalent, or CO2e. The most useful boundary covers ten areas: raw material extraction, supplier electricity, supplier fuel, industrial process emissions, packaging, inbound transport, warehousing, purchased services, waste treatment, and product use or end-of-life. Each area reflects a different operational cause.
A metal component may carry emissions from mining, smelting, factory power, and ocean freight. A food ingredient can add land-use change, refrigeration, packaging, and spoilage. These details matter because spend-based estimates often hide large differences between suppliers. Procurement teams should request activity data, such as kilograms shipped, kilowatt-hours consumed, fuel used, and production volume. They can then apply recognized emission factors and document assumptions under the GHG Protocol.
Measurement is rarely perfect. Supplier data may be incomplete, outdated, or calculated with different boundaries. That weakness should be recorded, not quietly ignored. A practical assessment separates direct emissions, purchased-energy emissions, and value-chain emissions. It also checks shipment consolidation, material efficiency, recycled content, and expected product life. One overlooked warehouse transfer can distort the result. So can treating renewable electricity claims as automatic proof of low emissions. Reliable procurement analysis combines supplier evidence, transparent calculations, and regular verification. The numbers should guide better choices, but they should remain open to correction.

Cradle-to-gate greenhouse gas emissions benchmarks for commonly procured materials, measured in tonnes of CO₂e per tonne of material.
Carbon intensity varies by supplier, geography, recycled content, energy source and production technology. The benchmarks are aligned with widely used lifecycle-assessment ranges reported by the International Energy Agency, the Intergovernmental Panel on Climate Change and national greenhouse-gas conversion-factor datasets.
Top 10 Types of CO2 Emissions for Global Procurement
Classifying the Ten Main Procurement-Related Emission Types
Procurement teams often see one invoice, but carbon hides across ten emission types: raw material extraction, purchased components, packaging, capital equipment, electricity inputs, fuel production, inbound freight, warehousing, supplier waste, and product end-of-life services. This classification adapts the GHG Protocol Scope 3 Standard, which defines 15 value-chain categories. It keeps attention on purchased goods and services, rather than treating procurement as a single data field.
The numbers are significant. CDP’s 2023 supply-chain report found that companies’ upstream emissions averaged 11.4 times their operational emissions. A small metal part may carry mining, smelting, machining, and ocean freight emissions before reaching a loading dock. Refrigerated storage adds another layer. Sometimes, the data is missing.
A reliable assessment should combine supplier activity data, product carbon footprints, transport records, and spend-based estimates. The International Energy Agency reported global energy-related CO2 emissions of about 37.4 billion tonnes in 2023, showing the scale behind energy-intensive purchasing decisions. Procurement professionals should separate scope, avoid double counting, and record assumptions clearly. For example, a freight estimate based only on invoice value may hide distance, load factor, and fuel type. That method is practical, but imperfect. It needs review. Sources: GHG Protocol Scope 3 Standard; CDP, Engaging the Chain: Driving Speed and Scale, 2023; IEA, Global Energy Review 2024.
| No. | Procurement-Related Emission Type | GHG Protocol Classification | Typical Procurement Source | Primary Emission Drivers | Recommended Activity Data | Common Calculation Method | Practical Reduction Levers |
|---|---|---|---|---|---|---|---|
| 1 | Purchased Goods and Services |
Scope 3, Category 1 Upstream value-chain emissions |
Raw materials, components, packaging, consumables, outsourced services and digital services | Material extraction, agricultural production, manufacturing energy, process emissions and supplier operations | Quantity purchased, mass, supplier-specific emissions, product carbon footprint or purchase expenditure | Supplier-specific product data; activity-based life-cycle assessment; or spend-based screening using environmentally extended input-output factors | Low-carbon specifications, recycled content, material efficiency, supplier engagement, renewable electricity and longer product life |
| 2 | Capital Goods |
Scope 3, Category 2 Upstream value-chain emissions |
Buildings, production equipment, vehicles, information-technology hardware and infrastructure | Steel, cement, aluminum, electronics manufacturing, construction activity and equipment production | Asset type, quantity, mass, embodied-carbon declaration or capital expenditure | Product-level life-cycle assessment, material-based factors or spend-based estimation | Design for low embodied carbon, refurbishment, modularity, recycled materials, equipment life extension and energy-efficient specifications |
| 3 | Fuel- and Energy-Related Activities |
Scope 3, Category 3 Emissions not included in Scope 1 or Scope 2 |
Purchased electricity, fuels, heating, cooling and energy used by contracted operations | Fuel extraction, processing, refining, electricity generation and transmission or distribution losses | Kilowatt-hours of electricity, liters or kilograms of fuel, or energy expenditure | Activity data multiplied by upstream fuel and energy emission factors | Reduce energy demand, procure renewable electricity, electrify equipment and improve energy efficiency |
| 4 | Upstream Transportation and Distribution |
Scope 3, Category 4 Purchased logistics and inbound distribution |
Freight forwarding, supplier-to-site delivery, warehousing and third-party distribution services | Transport mode, distance, shipment mass, vehicle efficiency, fuel type and warehouse energy | Shipment mass, distance, route, mode, fuel use, transport spend and storage days | Ton-kilometer factors, carrier fuel data, distance-based factors or spend-based factors | Localize supply, consolidate shipments, use rail or sea where practical, increase load factors and reduce expedited freight |
| 5 | Waste Generated in Operations |
Scope 3, Category 5 Waste treatment from purchased operations |
Waste collection, recycling, composting, wastewater treatment, incineration and landfill services | Waste material type, treatment route, methane formation, transport and avoided or generated energy | Waste mass by material and treatment method | Waste-type-and-treatment-specific emission factors, including landfill and recycling factors | Prevent waste, increase reuse and recycling, redesign packaging, segregate materials and select lower-impact treatment |
| 6 | Business Travel Services |
Scope 3, Category 6 Purchased travel and accommodation |
Air travel, rail travel, hotel stays, car rental and ground transportation | Travel distance, transport mode, cabin class, vehicle type, occupancy and hotel energy use | Passenger kilometers, travel routes, hotel room nights, rental distance or travel expenditure | Mode-specific distance factors, hotel-night factors or spend-based screening factors | Virtual meetings, rail substitution, travel policy, efficient routing, longer stays and lower-impact accommodation criteria |
| 7 | Employee Commuting Services and Programs |
Scope 3, Category 7 Employee travel to and from operational sites |
Shuttle services, commuter programs, parking operations and mobility services arranged or purchased by the organization | Commuting distance, vehicle type, occupancy, fuel use and transport mode | Employee travel survey results, passenger kilometers, shuttle fuel use and mode share | Mode-specific distance factors or fuel-based calculations | Public-transit support, active-travel facilities, shared mobility, flexible work and low-emission shuttle vehicles |
| 8 | Upstream Leased Assets |
Scope 3, Category 8 Leased assets not included in Scope 1 or Scope 2 |
Leased offices, warehouses, vehicles, machinery and other assets operated by the reporting organization | Electricity, heating, cooling, fuel use, refrigerant leakage and asset utilization | Floor area, energy consumption, fuel consumption, lease duration and occupancy | Metered energy data, landlord-provided data, area-based factors or asset-specific factors | Green-lease clauses, energy performance requirements, renewable energy, efficient equipment and sub-metering |
| 9 | Purchased Product Processing |
Scope 3, Category 10 Processing of products sold |
Contract manufacturing, finishing, assembly, coating, cutting, blending or other processing performed after purchase | Processing electricity, fuels, heat, compressed air, process chemicals and production losses | Processed quantity, energy consumption, production hours, yield losses and supplier process data | Supplier process data, energy-based factors or product life-cycle assessment | Specify efficient processes, reduce processing losses, optimize batch sizes, electrify heat and use lower-carbon energy |
| 10 | End-of-Life Treatment of Purchased Products |
Scope 3, Category 12 Disposal of products and packaging |
Product take-back, packaging disposal, recycling, composting, incineration and landfill services | Product mass, material composition, disposal route, recycling rate and methane or energy recovery | Units sold or purchased, product mass, packaging mass and assumed regional disposal mix | Material-specific end-of-life emission factors and region-specific waste-treatment assumptions | Design for reuse and recyclability, reduce packaging, increase recycled content, provide disposal guidance and establish take-back systems |
Tracing emissions across international supply chains starts with the purchase order, not the factory gate. The ten most visible sources are purchased materials, capital goods, fuel production, purchased electricity, upstream freight, warehousing, business travel, employee commuting, product processing, and product end-of-life. The GHG Protocol Scope 3 Standard provides this category structure for procurement teams. It also exposes a difficult truth: supplier data is often incomplete. Estimates can be useful, but they are not facts.
Scale matters. The International Energy Agency reported about 37.8 gigatonnes of energy-related CO2 emissions in 2023. International transport adds hidden movement between mines, ports, warehouses, and assembly sites. The International Maritime Organization estimates shipping produced roughly 3% of global greenhouse gas emissions in recent years. CDP research has also found that supply-chain emissions can average more than 11 times a company’s direct operational emissions. That ratio is striking, though sector boundaries and reporting quality can distort comparisons.
A practical review follows each material across borders. A copper component may carry emissions from extraction, diesel use, electricity, ocean freight, packaging, and factory scrap. Procurement teams should request activity data, transport distances, energy sources, and verified emission factors. Spend-based estimates help fill gaps. They should not become permanent shortcuts. Our own assessment can still miss subcontractors or return shipments. That uncertainty deserves a visible note in every sourcing decision.
Top 10 Types of CO2 Emissions for Global Procurement?
Comparing Emission Sources by Procurement Category
Procurement emissions vary sharply by category, not purchase price. The 2020 CDP Global Supply Chain Report found that supply-chain emissions were 11.4 times higher than direct operational emissions. This makes supplier data essential. Construction materials often dominate footprints. The International Energy Agency estimates that steel produces about 2.6 gigatonnes of CO2 annually, while cement contributes roughly 2.3 gigatonnes. Freight, packaging, electricity, chemicals, and machinery can add further hidden emissions.
Food and agricultural procurement also require careful measurement. The Food and Agriculture Organization reports that global agrifood systems generate approximately one-third of human-caused greenhouse gas emissions. Logistics creates another visible source. Aviation contributes around 2% of global energy-related CO2 emissions, according to the IEA, while road freight remains important for regional purchasing. Digital services appear lighter, but data centres, hardware production, and short replacement cycles still matter. The boundary is imperfect. Procurement teams often compare supplier estimates with inconsistent methods.
Tips: Build a category-level emissions map before selecting reduction targets. Request Scope 1, 2, and 3 data, product carbon footprints, and calculation methods. Prioritise steel, cement, food, freight, and energy-intensive equipment first. Use activity data, such as tonnes purchased, kilometres shipped, or kilowatt-hours consumed. Do not rely on generic averages forever. They are useful starting points, but they can hide real supplier differences.
Procurement teams need more than a single carbon score. They should examine ten emission sources: purchased materials, supplier energy, manufacturing, inbound transport, warehousing, packaging, business travel, employee commuting, waste, and product use or disposal. These categories reveal where purchasing choices create emissions. A steel component may carry more impact than its shipping route. A lightweight package can reduce transport emissions, but its production may still require intensive energy.
Practical analysis starts with supplier-specific data. Request energy records, production volumes, fuel types, and shipment distances. Compare these figures with recognized emissions factors when primary data is unavailable. The Greenhouse Gas Protocol offers a useful accounting structure. However, estimates can hide important differences. One supplier may report carefully, while another uses broad industry averages. That comparison is imperfect. It still supports better questions and more transparent decisions.
Tips: Add carbon data beside price, quality, lead time, and resilience. Set a common reporting template for suppliers. Check whether renewable energy claims include credible evidence. Review transport modes, order frequency, and packaging weight together. Small purchasing changes can matter. Revisit the data annually, because production methods and logistics routes change. Avoid choosing the lowest reported footprint without checking its boundaries, assumptions, and calculation date.