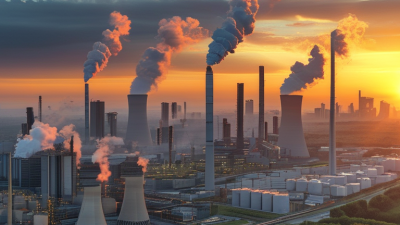
2026 Best Carbon Emissions by Year Guide for Global Buyers

Global buyers need more than a single carbon figure. They need carbon emissions by year, measured consistently across products, suppliers, and regions. Annual data reveals whether a company is reducing emissions or merely reporting a temporary decline.

The Global Carbon Budget 2024 estimated fossil carbon dioxide emissions at about 37.4 billion tonnes in 2024. It also projected total human-caused emissions near 41.6 billion tonnes, including land-use change. The International Energy Agency reported energy-related CO2 emissions above 37 billion tonnes in 2023. These figures show the scale of the challenge. They also expose a common weakness: datasets use different boundaries, methods, and reporting periods.

Definitions matter.

For procurement teams, this guide connects annual emissions data with practical supplier checks. Review Scope 1, Scope 2, and relevant Scope 3 emissions. Ask whether electricity factors are location-based or market-based. Check the reporting boundary, base year, verification status, and whether offsets are separated from actual reductions. A polished dashboard can still hide missing categories.

Fatih Birol, Executive Director of the IEA, said, “The age of clean energy is upon us.” His statement reflects a measurable shift in investment, but progress remains uneven across industries and countries. The UNEP Emissions Gap Report 2024 warned that current policies still leave the world far from a Paris-aligned pathway.

Numbers can mislead.

Historical comparisons are useful, yet they are not perfectly comparable. Company mergers, production changes, grid factors, and revised inventories can alter the trend. Responsible buyers should document these limitations, request primary evidence, and compare like with like. This approach supports more credible decisions in 2026.
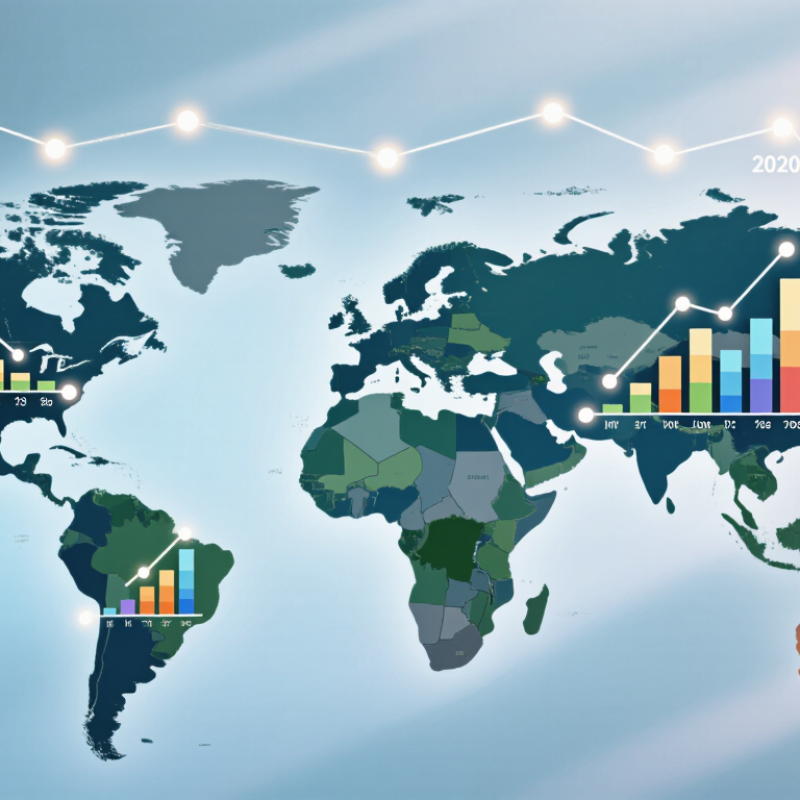
2026 Best Carbon Emissions by Year Guide for Global Buyers

What Carbon Emissions by Year Mean for Global Buyers

Carbon emissions by year show how an economy, industry, or supplier changes over time.

For global buyers, this timeline reveals more than a single annual figure. It can show whether emissions fall steadily, rise during expansion, or drop because production moved elsewhere. A reliable review should identify the baseline year, reporting boundary, production volume, and measurement method. Without these details, comparisons may look precise but remain misleading.

Buyers should request verified Scope 1 and Scope 2 data, while checking relevant Scope 3 categories. A factory reporting 10,000 tonnes in 2024 may appear cleaner than one reporting 12,000 tonnes in 2023. Yet the first facility may have doubled its output. Emissions intensity, such as tonnes of carbon dioxide equivalent per product unit, adds useful context. Keep the unit visible.

Year-by-year records also support practical purchasing decisions. A buyer can compare three years of utility bills, audit documents, renewable energy claims, and production records. Independent assurance improves confidence, especially when figures affect supplier selection or reporting obligations.

Still, verification is not perfection. Methods differ, data can be incomplete, and early estimates may later change. That weakness deserves attention, not concealment. Ask what was excluded, which assumptions were used, and whether the same method applied each year. Small gaps can alter a large procurement decision.


How Annual Carbon Emissions Are Measured and Compared

To compare annual carbon emissions, buyers must define the boundary first. Territorial emissions count gases released within a country’s borders. Consumption-based figures also include emissions embedded in imported goods. These measures can produce very different rankings. Definitions matter.

Most inventories multiply activity data by an emission factor. Electricity use, fuel combustion, cement production, and land-use change are measured separately. Results are reported as tonnes of carbon dioxide equivalent, or CO2e. This unit combines several greenhouse gases using global warming potential values from the IPCC Sixth Assessment Report. Scope 1 covers direct releases, while Scope 2 covers purchased energy. Scope 3 includes wider supply-chain emissions, often with greater uncertainty.

Reliable comparisons need the same boundary, method, currency year, and population basis. The Global Carbon Budget 2024 estimated fossil carbon dioxide emissions at about 37.4 billion tonnes in 2024, with land-use change adding roughly 4.2 billion tonnes. The International Energy Agency reported energy-related CO2 emissions near 37.4 billion tonnes in 2023. These figures are not perfectly interchangeable. One includes broader carbon sources, while the other focuses on energy. That gap matters.

For procurement decisions, compare annual totals alongside emissions per product, per unit of revenue, and per person. Check whether renewable electricity claims use measured consumption or certificates. Ask for activity data, emission factors, verification dates, and restatement rules. Real data is messy. Estimates can change when national inventories improve. A transparent limitation is more credible than false precision.

Key Global Trends in Carbon Emissions from 1990 to 2026

Carbon emissions have risen sharply since 1990, although annual patterns remain uneven. The Global Carbon Budget 2024 estimated fossil carbon dioxide emissions at 37.4 gigatonnes in 2024, with total human-caused emissions near 41.6 gigatonnes. In 1990, fossil CO2 emissions were approximately 22.7 gigatonnes, based on historical datasets compiled by the Global Carbon Project. This represents a difficult long-term increase.

The 2020 decline was temporary. Global energy-related CO2 emissions fell by about 5.2% during the pandemic year, according to the International Energy Agency, then rebounded as industrial activity returned. By 2023, energy-related emissions reached a new high of roughly 37.4 gigatonnes. The signal is clear. Progress is not linear.

For 2026, buyers should separate verified historical figures from forward-looking estimates. No complete global emissions total exists yet for that year. Scenario studies from the United Nations Environment Programme indicate that current policies still point toward around 3°C of warming this century, while the IPCC reports average global greenhouse gas emissions of about 59 gigatonnes of CO2 equivalent annually during 2011–2020. These figures support practical screening: compare suppliers by reported scope emissions, production-year boundaries, electricity sources, and independent verification. Data quality remains imperfect. Procurement decisions can become misleading when one annual number hides changing factory output, transport routes, or land-use impacts.

2026 Best Carbon Emissions by Year Guide for Global Buyers - Key Global Trends in Carbon Emissions from 1990 to 2026

Global carbon emissions trend — selected benchmark years
Year Global CO₂ Emissions from Fossil Fuels and Industry
(Gt CO₂)
Approximate Change Since 1990 Year Status Key Trend for Global Buyers
1990 22.7 Baseline Historical estimate Starting point for long-term comparison and carbon accounting.
1995 23.5 +3.5% Historical estimate Global emissions increased gradually as energy demand expanded.
2000 25.1 +10.6% Historical estimate Manufacturing growth and coal use became increasingly important.
2005 29.5 +30.0% Historical estimate Rapid industrialization increased the carbon intensity of global supply chains.
2010 33.1 +45.8% Historical estimate Post-financial-crisis recovery restored strong growth in energy-related emissions.
2015 35.5 +56.4% Historical estimate The Paris Agreement increased demand for emissions measurement and reduction plans.
2019 36.7 +61.7% Historical estimate A pre-pandemic peak highlighted the need for measurable supply-chain decarbonization.
2020 34.8 +53.3% Historical estimate The COVID-19 disruption caused an exceptional temporary decline in emissions.
2021 36.4 +60.4% Historical estimate Economic recovery produced a sharp rebound in energy demand and emissions.
2022 36.6 +61.2% Historical estimate Energy security concerns increased attention to efficiency, renewable power, and supplier data.
2023 36.8 +62.1% Historical estimate Global emissions remained near record levels despite faster clean-energy deployment.
2024 37.4 +64.8% Latest published estimate Record-level emissions reinforce the importance of low-carbon procurement and transparent reporting.
2025 Not yet included in this historical series Not available Pending final dataset Use verified annual inventories or the latest Global Carbon Budget release before making purchasing decisions.
2026 Not yet available Not available Future reporting year Evaluate suppliers using verified Scope 1, 2, and relevant Scope 3 data rather than unverified forecasts.
Data note: Values are rounded global estimates for CO₂ emissions from fossil fuels and industry, excluding land-use change emissions. Historical figures are based on the Global Carbon Project's Global Carbon Budget datasets and may be revised as inventories improve. The 2025 and 2026 entries are intentionally marked as unavailable rather than presented as unsupported forecasts.

How Countries, Industries, and Products Differ in Emissions

Carbon emissions change sharply by year, country, industry, and product. The Global Carbon Budget 2024 estimated fossil carbon dioxide emissions at about 36.8 gigatonnes in 2023. China remained the largest national source, while the United States recorded much higher historical emissions per person. India’s annual emissions are rising with industrial growth, but its per-person figure remains lower than many developed economies.

Country totals can mislead. Production-based accounting assigns emissions to factories, while consumption-based accounting follows imported goods. A solar panel, steel frame, or smartphone may carry carbon released in another country. The comparison is useful, but not perfectly clean. Buyers should check reporting boundaries, electricity sources, transport stages, and recycled content.

Industry differences are equally practical. The International Energy Agency reported record energy-related emissions in 2023, driven partly by power generation and industrial activity. The Global Cement and Concrete Association estimates cement contributes roughly 7% of global carbon dioxide emissions. Steel production adds more than 2 gigatonnes of carbon dioxide annually, according to the IEA. Product footprints require lifecycle assessment, not factory-only measurements. A lighter product can still perform poorly if it breaks quickly or travels long distances. Data quality remains uneven. That weakness deserves attention.

2026 Best Carbon Emissions by Year Guide for Global Buyers

Territorial CO₂ emissions by country in 2023, excluding emissions from international shipping and aviation.

China, the United States, India, Russia, Japan, and Germany are shown for comparison. Territorial emissions reflect CO₂ released within each country’s borders and do not represent consumption-based or product-level carbon footprints.

Data source: Global Carbon Budget 2024, 2023 territorial fossil CO₂ emissions; values rounded to one decimal gigatonne (Gt CO₂).

How Buyers Can Use Yearly Emissions Data for Decisions

Global buyers can turn yearly emissions data into practical purchasing evidence. The IEA reported 37.8 gigatonnes of energy-related carbon dioxide emissions in 2024, up 0.8% from 2023. The Global Carbon Budget 2024 estimated fossil carbon dioxide emissions at 37.4 gigatonnes. These figures use different boundaries, so direct comparison needs care.

Start with a clear baseline year. Compare absolute emissions, emissions intensity, and production volume together. A supplier may reduce emissions per tonne while increasing total output. That result deserves closer review.

Buyers should request Scope 1, Scope 2, and relevant Scope 3 data, plus the calculation method and verification level. Ask whether renewable electricity claims use contracts, certificates, or physical supply. The difference can affect procurement decisions.

Use yearly data to identify real trends, not isolated improvements. A three-year decline is more informative than one impressive annual figure. The IPCC stresses that emissions reductions must be rapid, deep, and sustained across sectors.

The data also has limits. National inventories are revised, supplier boundaries change, and some Scope 3 figures remain estimated. A clean spreadsheet can still tell an incomplete story. Record these uncertainties beside each supplier score. Then test whether lower emissions also meet quality, delivery, durability, and cost requirements. Carbon data should guide decisions, not replace technical judgment.